I got a great question this morning from some colleagues who attended of one of our recent journey mapping workshops together: “Our marketing team would like to map the prospect journey from awareness up to purchase, but there are so many entry points and no linear process. Prospects could see an ad, then read one of our whitepapers, then come to our website, and then attend a think tank—or learn about us in any other number of ways. And any of those things could happen in any combination and in no particular order. We can’t map 300 different combos. So where do we start?”
This question recognizes that no two customer experiences are exactly the same. Customers use different channels to accomplish their goals, they complete the various steps in different orders, and they bring their own individual needs and expectations to the party.
So how can map all the variations in your customers’ journeys? The answer is that you can’t.
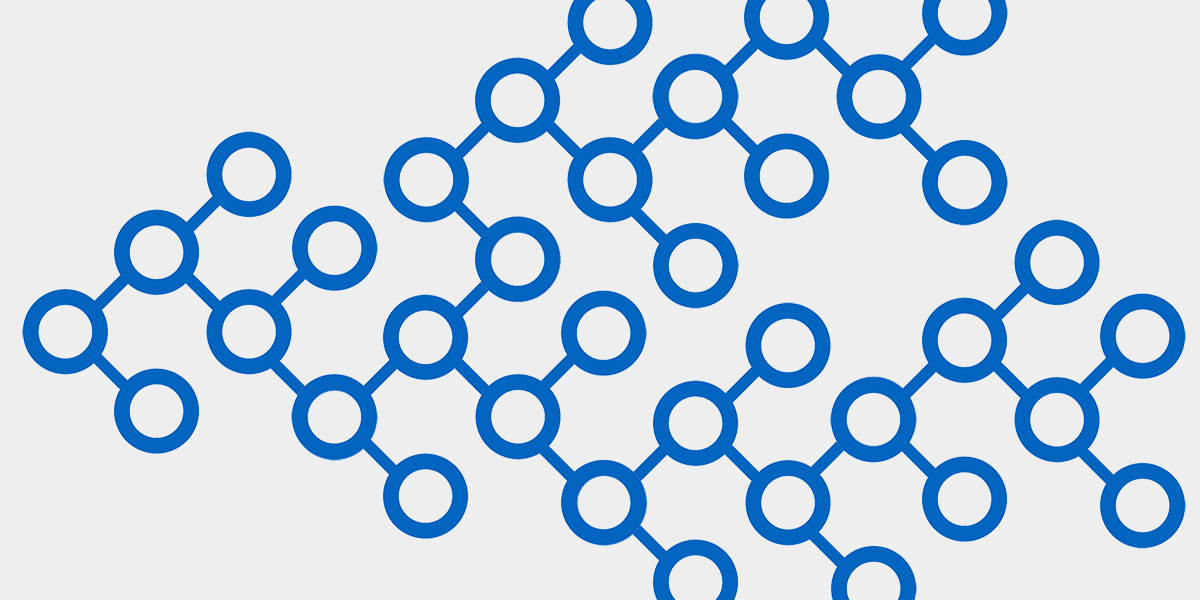
If you tried, you wouldn’t get a journey map, but what I like to call a Crazy Tree Branching Diagram, similar to what I’ve depicted in the image above. One of the main reasons that journey maps are so effective is that they visualize customers’ stories. A CTBD could also tell a story, I suppose—but it would decidedly be one of the choose-your-own-adventure variety, and not one that would effectively communicate with executives, stakeholders, or employees.
So resist the urge to create a CTBD.
Touchpoints
Instead, narrow your list of touchpoints to a reasonable set that you can map. To do this, focus on the touchpoints that are:
- Most commonly used — What touchpoints impact the largest number of customers?
- Most problematic — Where do you know customers experience friction?
- Have the biggest upside for your business — Where are you currently seeing the greatest conversion rates?
- Have the biggest downside for your business — Where are you losing customers in the sales process today?
Journey Flows
Next, string these touchpoints together in a flow that:
- Makes sense — Your prospects probably see an ad and then go to your website, not the other way around.
- Represents actual behavior — Look at what your data says about prospects’ behavior. If it’s more common for them to read a whitepaper and then attend a webinar, map the touchpoints in that order.
- Is problematic — Do you struggle to maintain continuity and consistency as customers shift from browsing your website to chatting with a support rep? Then that’s a great flow to map.
Keep in mind that these are just your hypotheses about which touchpoints are most important to your prospects and the order in which they complete the various steps of the journey. (And as I’ve written about before, hypothesis maps are necessary but dangerous.) So after mapping all of this out, be sure to (in)validate your assumptions with customers.
***
Thanks to Anne B. & Katie W. for sending us this question!