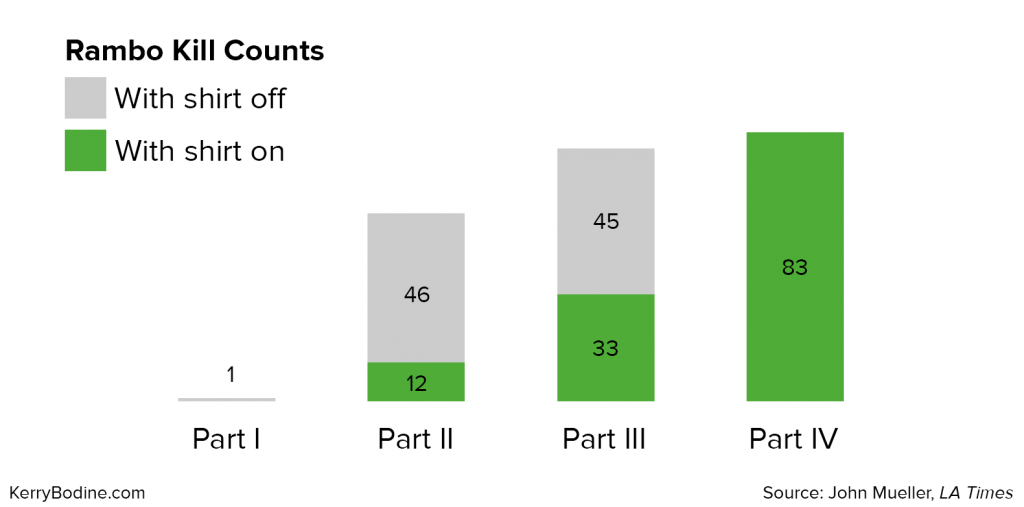
I love a good data graphic. One of my favorites comes from the website Flowing Data (and is replicated in the image above). You can clearly see that the number of Rambo’s kills increased across Rambo Parts I, II, III, and IV. You can also see that in each subsequent movie, Rambo makes a larger percentage of these kills with his shirt on!
I nearly died laughing when I saw this graphic for the first time—and I immediately assumed that the reason for this torso trend was Sylvester Stallone’s aging physique. (Hey, he still looks great in Rambo IV, but none of us is a stranger to vanity…)
Then I got to thinking: Maybe it wasn’t vanity. Perhaps Stallone just got a bit more modest as the years went on. Or maybe he had negotiated a price for each shirtless kill, and the studio didn’t want to blow its budget on bare-chested violence. Or maybe he was prone to horrible rashes that cropped up after extended shooting in the jungle. Or maybe it was audience preference. (“C’mon, Stallone, put your shirt back on already!”)
The point is this: As awesome as the graphic is, it has a limited function. It can tell us WHAT happened—Sly made more kills, and he made a greater percentage of those kills with his shirt on. But it cannot—in any way—tell us WHY. And, if you try to guess the WHY like I did, you’re likely to be wrong.
Your customer experience program functions in exactly the same way. You need a mix of quantitative and qualitative data to give you a complete picture of your customers’ behaviors, attitudes, emotions, and needs.
Quantitative data tells you WHAT your customers do and WHERE their pain points are. Web analytics, for example, can show you the paths that customers take through your site and where they run into dead ends. Your Net Promoter Score can help you understand high-level customer sentiment and zero in on key problems areas. Past purchase data tells you what your customers are buying—and what they’re not.
Qualitative data tells you WHY customers think, feel, and act they way they do and HOW you need to fix their problems. Open-ended survey questions will uncover the details of what went wrong during the hotel check-in process. One-on-one interviews will help you understand what customers were thinking when they abandoned your shopping cart. Observational data will provide insights about how your product or service fits into customers’ larger ambitions or objectives. Co-creation workshops and usability testing will show you what kinds of solutions will meet customers’ needs—and which ones won’t.
As we continue to develop our capabilities to integrate more quantitative data—such as a customer’s location, her current context, the weather, the time of day, and the last time she bought laundry detergent—we’ll get better at predicting (and delivering) what customers need.
And perhaps in the future when we’re all wearing devices that measure our heart rate, galvanic skin response, and eye movements on a 24/7 basis, we’ll be able to quantitatively track customers’ emotions as they interact with a company.
But there is no substitute for qualitative customer research. Even in our magical data-filled future, you’ll still need qualitative research methodologies to get at the deepest insights about your customers and how you can meet their needs. Without qual, you’ll need to make a lot of assumptions about your customers—and those assumptions have the potential to derail your customer experience efforts and put your business at risk.
***
How have you combined quant and qual data to provide a great customer experience? Let me know!


