The concept of customer journeys isn’t new to the customer experience world. Yet it’s taken some time for organizations to evolve from simply creating journey maps to actively using the journey as a framework for how they do business. One of the most exciting developments of the past few years is the recognition, in the words of McKinsey, that “end-to-end customer journeys, not individual touchpoints, are the unit to measure when setting priorities for your customer-experience investments.”
Enter journey analytics: the measurement and analysis of key customer journeys—not just individual touchpoints.
It may seem like common sense to measure how well your organization supports customers as they try to achieve their goals. But the data to support this notion took a long time to surface, as many prime examples stayed hidden and well-guarded behind corporate walls. Fortunately, McKinsey’s anonymized (but published!) data will help you make the case for pivoting your organization’s measurement strategy.
Here are the crib notes (with my major takeaways as the headings):
The journey doesn’t equal the sum of its parts.
A media company looked at the new customer onboarding experience, “a journey that spanned about three months and involved an average of nine phone calls, a home visit from a technician, and numerous web and mail interactions.” Customer satisfaction scores for individual channels each consistently scored over 90%. But satisfaction for the entire end-to-end journey was nearly 40% lower. Ouch.
Journeys are better predictors of likelihood to recommend.
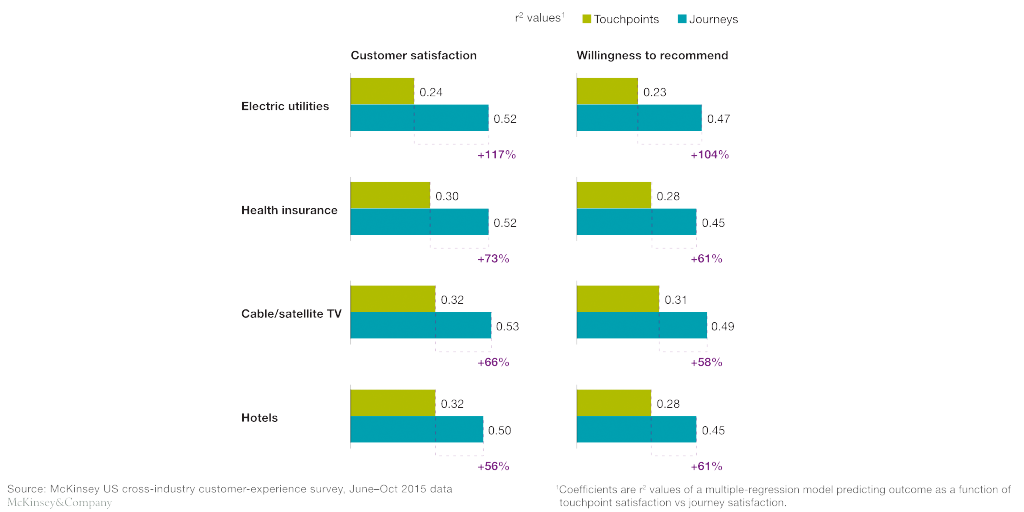
Ok, I’m gonna have to get a bit data wonky on you here, so hang with me. In statistics land, R-squared values, like those you see in the image above, always fall between 0 and 100%. An R-squared value of 0% means that the model in question—for us, the hypothesis that touchpoints or journeys account for satisfaction or willingness to recommend—explains NONE of the variability in the data. (Think of a bunch of random dots on a graph that you can’t draw a single line through.) A value of 100% means that the model in question explains ALL of the variability in the data. (Here, you’d have all the data points aligned perfectly through your line. When does that ever happen?)
McKinsey’s models of customer satisfaction and willingness to recommend both have R-squared values for journeys that hover around 50% for the electric utility, health insurance, cable/satellite TV, and hotel industries. I’d love it if these were higher, but it’s reasonable to assume that there are other factors that account for about half of customers’ satisfaction scores and referral behavior.
What’s notable is that depending on the industry, the R-squared scores for journeys range from 56 – 117% higher than those for touchpoints alone. Ergo: [inline-ctt]Journeys are better predictors than touchpoints of the business outcomes you care about.[/inline-ctt]
Journeys present more opportunity for differentiation.
In one (unnamed) industry, McKinsey compared satisfaction with both touchpoints and journeys across companies. The gap between the companies with the best and worst journey performance was 50% wider than between those with the best and worst touchpoint performance. And a wider gap equals more potential for you to differentiate from your competitors.
Journeys drive cold hard cash.
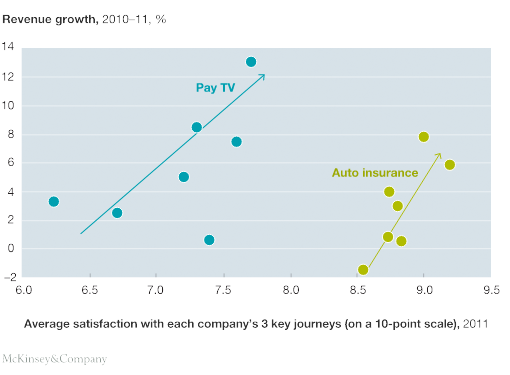
When McKinsey looked at the pay TV and auto insurance industries, it found that average satisfaction with each company’s three key journeys correlated with faster revenue growth. To be specific: “a one-point improvement on a ten-point [satisfaction] scale corresponds to at least a three-percentage-point increase in the revenue-growth rate.” Wow!

[inline-ctt]Journey analytics will be the way your organization measures customer experience in the future.[/inline-ctt] If you’re not there yet, your first step is understanding and prioritizing the journeys that matter most to your customers and to your business metrics.
***
This post is part of the Customer Experience Professionals Association’s Blog Carnival “Celebrating Customer Experience.” It is part of a broader celebration of Customer Experience Day. Check out posts from other CX Day bloggers & learn more at CXDay.org.


